Data Flow technical_representation (Gane & Sarson notation) are used to analyse system relationships and data via a process-oriented workflow.
They do represent graphically data flow through an information system.
They do not illustrate programming logic.
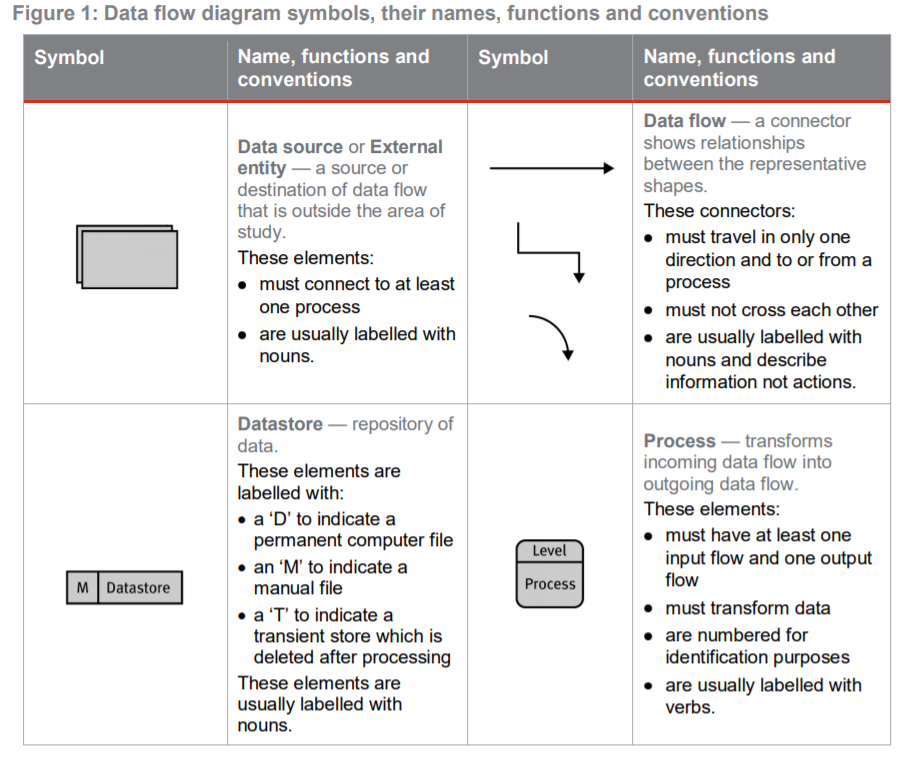
Data flow symbols are used to represent:
• data source
• flow
• storage
• processes
The following excerpt is from page 17 of Digital Solutions syllabus -

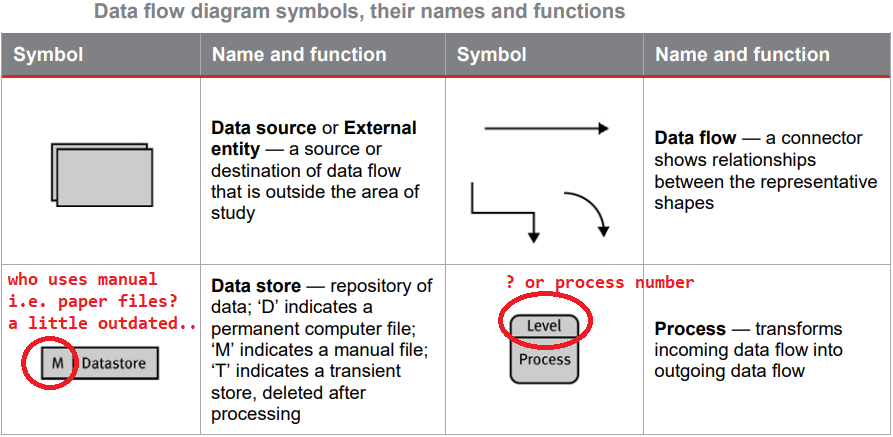
Questions can be put to the Digital Solution Syllabus writers:
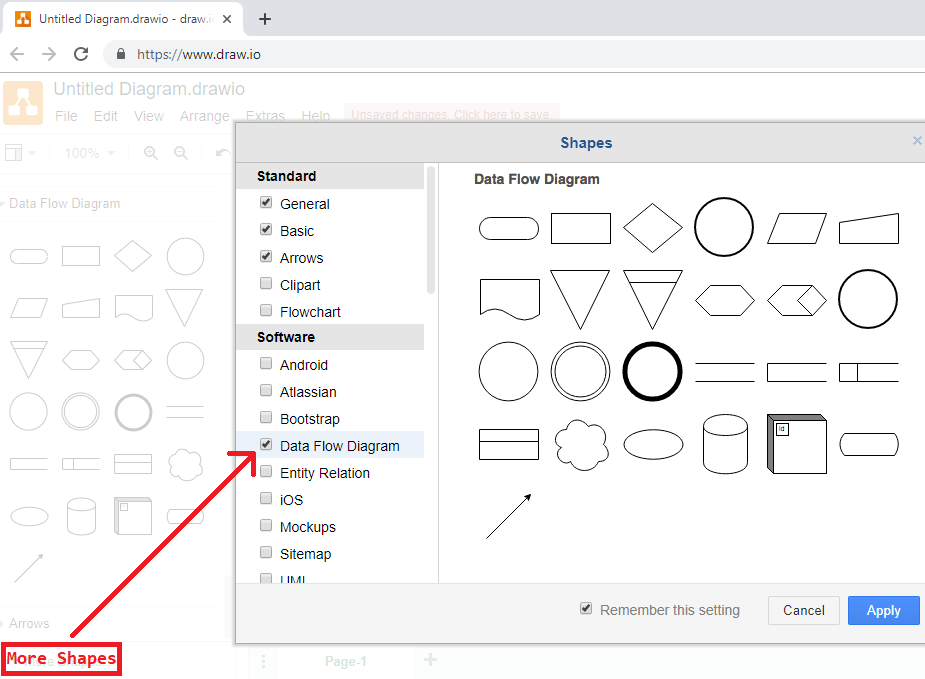
Either way, use draw.io to create DFDs (with a tiny bit of shape manipulation you can make the elements look exactly like the QCAA Digital Solutions syllabus. Remember, these technical_representation have been around since the 70s):
Creating Data Flow
❗ Datastores are usually left off context level DFDs. ❗
This isn't stated in the syllabus though, but generally level 0 DFDs are designed to show interactions between the system and external entities only.

Now turn into context level (i.e. level zero or level 0) DFD:
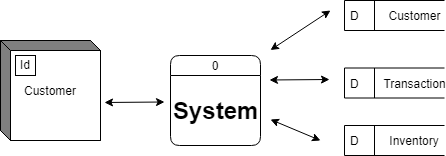
^^ Note: Context level DFD has only 1 process (Process 0: "system"). It's designed to show the interaction of the system with external entities.
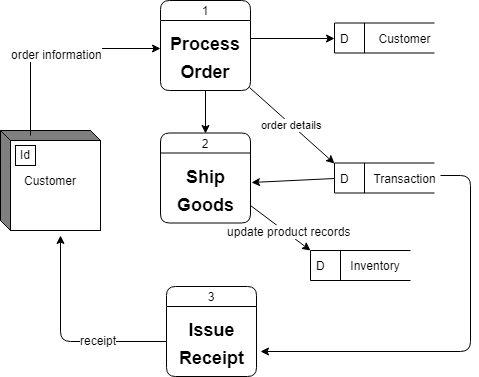
Level 1 DFD can break up (or break down) this process in greater detail:
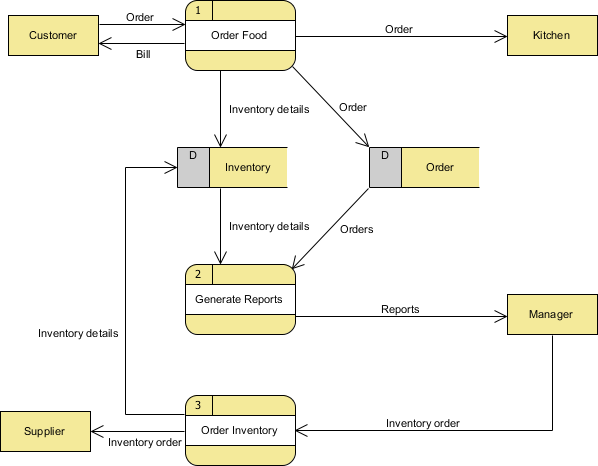
Another example of Level 1 DFD (not mine but you get the idea):
Level 2 (and beyond) DFD can continue decomposition of problem. At any level, the same number of external entities should always appear on every level regardless of depth:
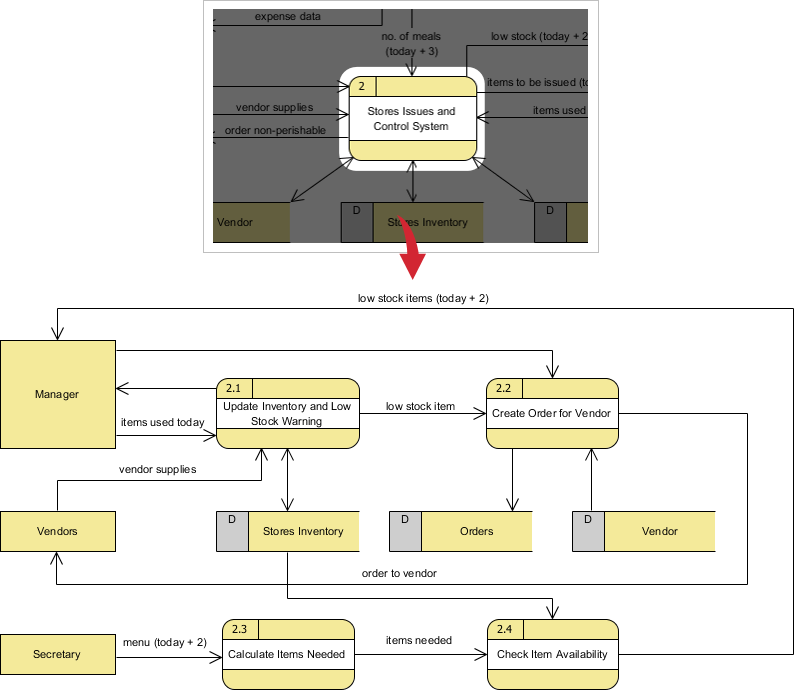
^^ Note: The notation of 2.1, 2.2 etc can help communicate the sub-steps (child steps) of the parent process.
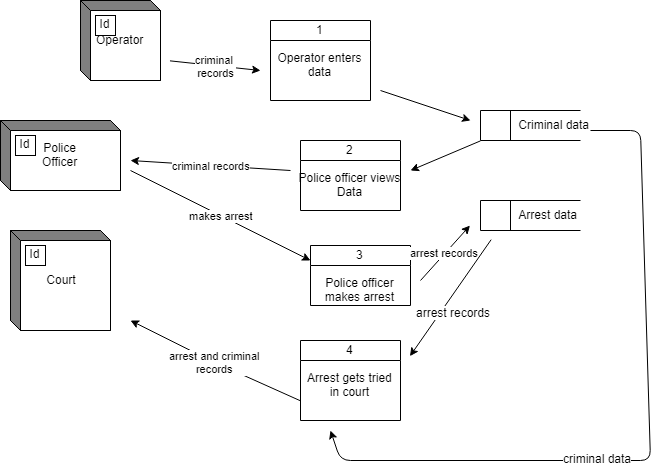
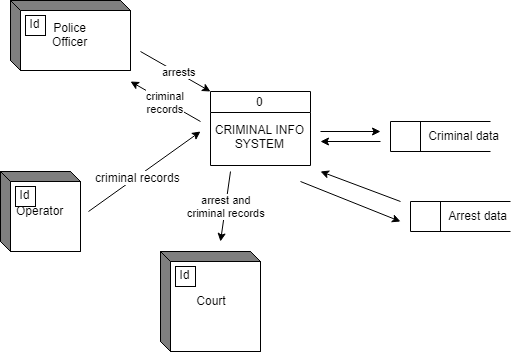
Criminal Information System Level 0 (Context level) DFD:
Criminal Information System Level 1 DFD: